Real space correlation plots
Global indicators of structural quality such as
R-value and freeR (Brünger, 1992) convey very little about the actual correctness of
the structure, and numerous examples exist of partially (or purposefully for
demonstration) incorrectly traced structures with unsuspicious statistical
descriptors (Dodson et al., 1996, Kleywegt
and Jones, 1995). In the case of molecular replacement structures, even checks based on
plausibility of the local geometry such as implemented in WHAT-IF or
PROCHECK may not immediately trigger strong warning signs, in particular at
low resolution and when refined with molecular dynamics protocols, where
geometric restraints dominate the refinement (Dodson et al., 1996). In general, careful inspection of regions flagged
in geometry checks, particularly Ramachandran plots (Sasisekharan, 1962, Ramachandran et al., 1963), nearly always reveals problems with a structure (Kleywegt and Brünger, 1996, Rupp and Segelke, 2001). However, the most comprehensive and fastest
assessment of local quality – provided structure factor amplitudes are
available - is the real space (RS) correlation coefficient (CC) between the
calculated model map and the ‘experimental’ map calculated from observed
intensities (Branden and Jones, 1990), particularly when the map contains a minimum of
model bias. The RSCC has the benefit of being scale independent compared to
real space R-values, and atoms placed correctly in weak density still correlate
highly. Areas with low real space correlation coinciding with areas of high
B-factors indicate that model tracing in these areas is in all likelihood
genuinely ambiguous due to lack of electron density. Deviations from the anti-correlation
of B and RSCC nearly always indicate problem areas worth investigating
(examples are provided in the next section). SFCHECK (Vaguine et al., 1999) and mapoverlap from the CCP4
suite provide real space correlation analysis. From a survey of the literature,
however, it appears that RSCC plots are not as frequently used as they probably
should be. The electron density server (EDS) at the
Clostridium Botulinum Serotype B Neurotoxin light chain protease - Synaptobrevin-II
complex. A
dramatic example of where the use of a real space correlation plot would have
provided early warning signs of an incorrect model is the complex of BotLCB with synaptobrevin (1F83).
The plot created by the web service (Figure 10) reveals extremely poor real
space correlation and excessive B-factors for the ligand.
Severe problems with the ligand refinement, including
absence of the ligand, must be expected. It is
worthwhile mentioning that deposition of structure factors for both BotLCB complexes indicates that an honest mistake was made.
Suppression of structure factors, when obvious warning signs are present, may
shed serious doubt on the validity of a structure, as recently discussed (Kleywegt
and Jones, 2002).
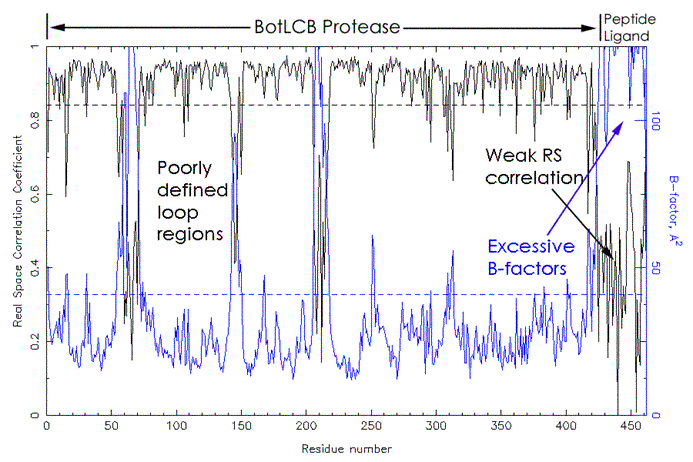
Figure 1: Real space correlation coefficient and B-factors plot. PDB entry 1F83 contains the model coordinates for the BotLCB protease - synaptobrevin-II complex (Hanson and Stevens, 2000). Shown in black (upper curve) is the residue-by-residue real space correlation coefficient, in blue the B-factors are plotted for each residue. The left part of the figure corresponds to the protease, which, with exception of a three loop regions shows normal behavior. The synaptobrevin-II ligand peptide at the right figure edge, however, shows a very worrisome cross-over between abysmal real space correlation and excessive B-factors. A simple plot of this nature, inspected beforehand or submitted with the manuscript, would have raised sufficient flags to prevent the public discourse regarding the validity of the results (Rupp and Segelke, 2001). The plot (less descriptive labeling) was created by the S&W service (https://tuna.tamu.edu).
References:
Branden, C. I. and Jones, T. A. (1990) Between objectivity and subjectivity. Nature, 343, 687-689.
Brünger, A. T. (1992) Free R value: A novel statistical quantity for assessing the accuracy of crystal structures. Nature, 355, 472–475.
Dodson, E. J., Kleywegt, G. J. and Wilson, K. S. (1996) Report of a workshop on the use of statistical validators in protein x-ray crystallography. Acta Crystallogr, D52, 228-234.
Hanson, M. A. and Stevens, R. C. (2000) Cocrystal structure of synaptobrevin-II bound to botulinum neurotoxin type B at 2.0Å resolution. Nature Struct Biol, 7, 687-692.
Kleywegt, G. J. and Brünger, A. T. (1996) Cross-validation in crystallography: practice and applications. Structure, 4, 897-904.
Kleywegt, G. J. and Jones, T. A. (1995) Where freedom is given, liberties are taken. Structure, 3, 535-540.
Kleywegt, G. J. and Jones, T. A. (2002) Homo crystallographicus - quo vadis? Structure, 10, 465-472.
Ramachandran, G. N., Ramakrishnan, C. and Sasisekharan, V. (1963) Stereochemistry of polypeptide chain configurations. J Mol Biol, 7, 95–99.
Rupp, B. and Segelke, B. W. (2001) Questions about the structure of the botulinum neurotoxin B light chain in complex with a target peptide. Nature Struct Biol, 8, 643-664.
Sasisekharan, V. (1962) Stereochemical criteria for polypeptide and protein structures, Wiley and Sons, Madras, India.
Vaguine, A. A., Richelle, J. and Wodak, S. J. (1999) SFCHECK: a unified set of procedures for evaluating the quality of macromolecular structure-factor data and their agreement with the atomic model. Acta Crystallogr, D55, 191-20.